

Visualisation
keyto.IT visualizes your control-related content and data via a modern browser-based User Interface. Three different options for presentation and analysis are available for your convenience:
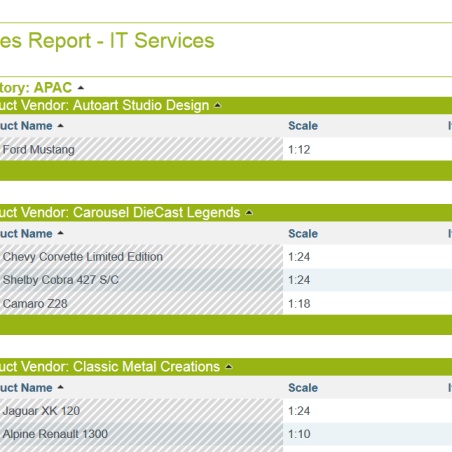
keyto.rep
Standard Reports summarize key metrics across periods for special target groups. Delivering exactly the information needed for particular activities. Reports are created periodically, on demand or automatically, for example when defined thresholds are exceeded or underrun. The reports can be created in standard data formats (pdf, rtf, xls or csv) and proceeded. Customizable templates are made available per mail or web-browser
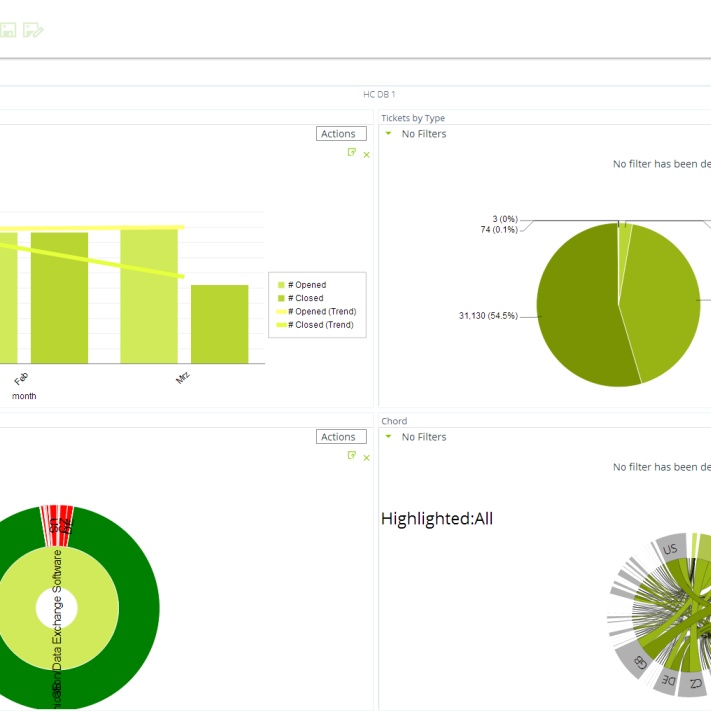
keyto.panel
Dynamic dashboards providing an overview on the current performance of the entire company at any time, but also for concrete occasions, if required.
Real-time-data is evaluated to identify and control important coherencies. Users can create their individual views on the analysis next to using the prepared dashboards.
Limitations in data evaluation are resolved by keyto.IT.
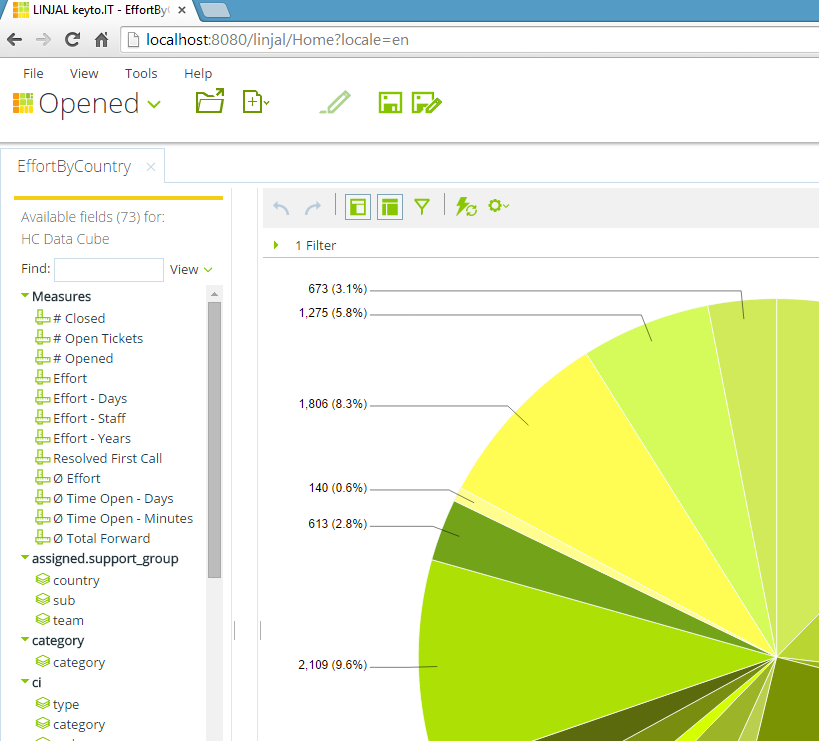
keyto.adhoc
use multifunctional Slice & Dice and drill-down functions for the analysis of complex circumstances. With the help of the keyto.IT ad hoc module individual extensive and in-depth analysis can be carried out regarding broad and deep aspects with little effort. With keyto.IT you can keep track on the big picture as well as deeply analyze certain questions regarding dynamic objects.
Every colleague, no matter if management board or service desk agent, can get exactly the right information for all important matters whenever required in a fast and easy way.